Most building automation projects fail long before the first dashboard goes live. The M&E contractor hands over, the BMS sits unread, HVAC runs outside schedule, and energy bills quietly drift upward. The gap is rarely the software. It is the missing engineering translation between what was installed and what the facility team actually needs to operate.
At Smart Tech Resources, our job is not to "install a BMS". It is to convert M&E implementation into a controllable, maintainable automation workflow grounded in the consultant's design intention, the site reality, and the operations team's daily decisions.
- BMS reliability is decided at the IO point and gateway planning stage, not at commissioning.
- AutoCAD drawings and consultant or IR review prevent costly rework and hidden engineering risk.
- Control points need stricter governance than monitoring points — they affect comfort, safety, and energy.
- Real value arrives after handover, through schedule tuning, kWh trending, and alarm refinement.
Step 1: Site Audit and M&E Understanding
The first step is to understand what is really at site — the M&E layout, HVAC equipment, electrical meters, sensors, control panels, and any existing BMS or SCADA. Equipment lists are not enough. We need to understand what the building team must see, control, alarm, trend, and report on a daily basis.
What we inspect
- Existing drawings, control panels, and available communication ports.
- Protocols already in use: Modbus, BACnet, controller networks, standalone meters, manual points.
- Operational pain points: high kWh, comfort complaints, late alarm response, poor meter visibility.
We then separate what is already integrable from what needs new work. Some equipment connects via existing controllers. Some needs new sensors or meters. Monitoring-only points are simpler; points tied to control logic demand stricter review.
Step 2: IO Point Study, Gateway Planning, AutoCAD Drawing, and Review
This is where the project becomes concrete. We count every required IO point — digital and analog input/output, meter registers, equipment status, alarms, setpoints, temperatures, flow, pressure, runtime, trip status, and energy consumption.
The point count drives everything downstream: controller sizing, wiring, panel design, gateway quantity, network topology, cost, and future maintenance. A wrong list looks fine on the quotation but breaks at commissioning.
Gateway planning
Gateway quantity depends on protocol mix, network separation, panel location, cable distance, and expansion headroom. A single gateway rarely covers a site with multiple plant rooms, floors, or mixed protocols.
Drawings and consultant review
AutoCAD drawings remove verbal-instruction risk. The package typically includes point schedules, wiring diagrams, panel layout, gateway location, network architecture, and connection references — so the client, contractor, consultant, and site team work from one source of truth.
Drawings and point planning should then be reviewed with the client's consultant or IR. They confirm design intention, control boundary, safety limits, compliance expectations, and that the proposed integration will not disturb existing M&E operation.
We define what needs to be monitored, controlled, alarmed, trended, or reported before hardware sizing is finalized.
We decide gateway quantity based on protocol, location, cable route, network separation, and future expansion.
Drawings make the system architecture visible before site installation and commissioning.
The review confirms that automation supports the approved M&E intention instead of creating hidden risk.
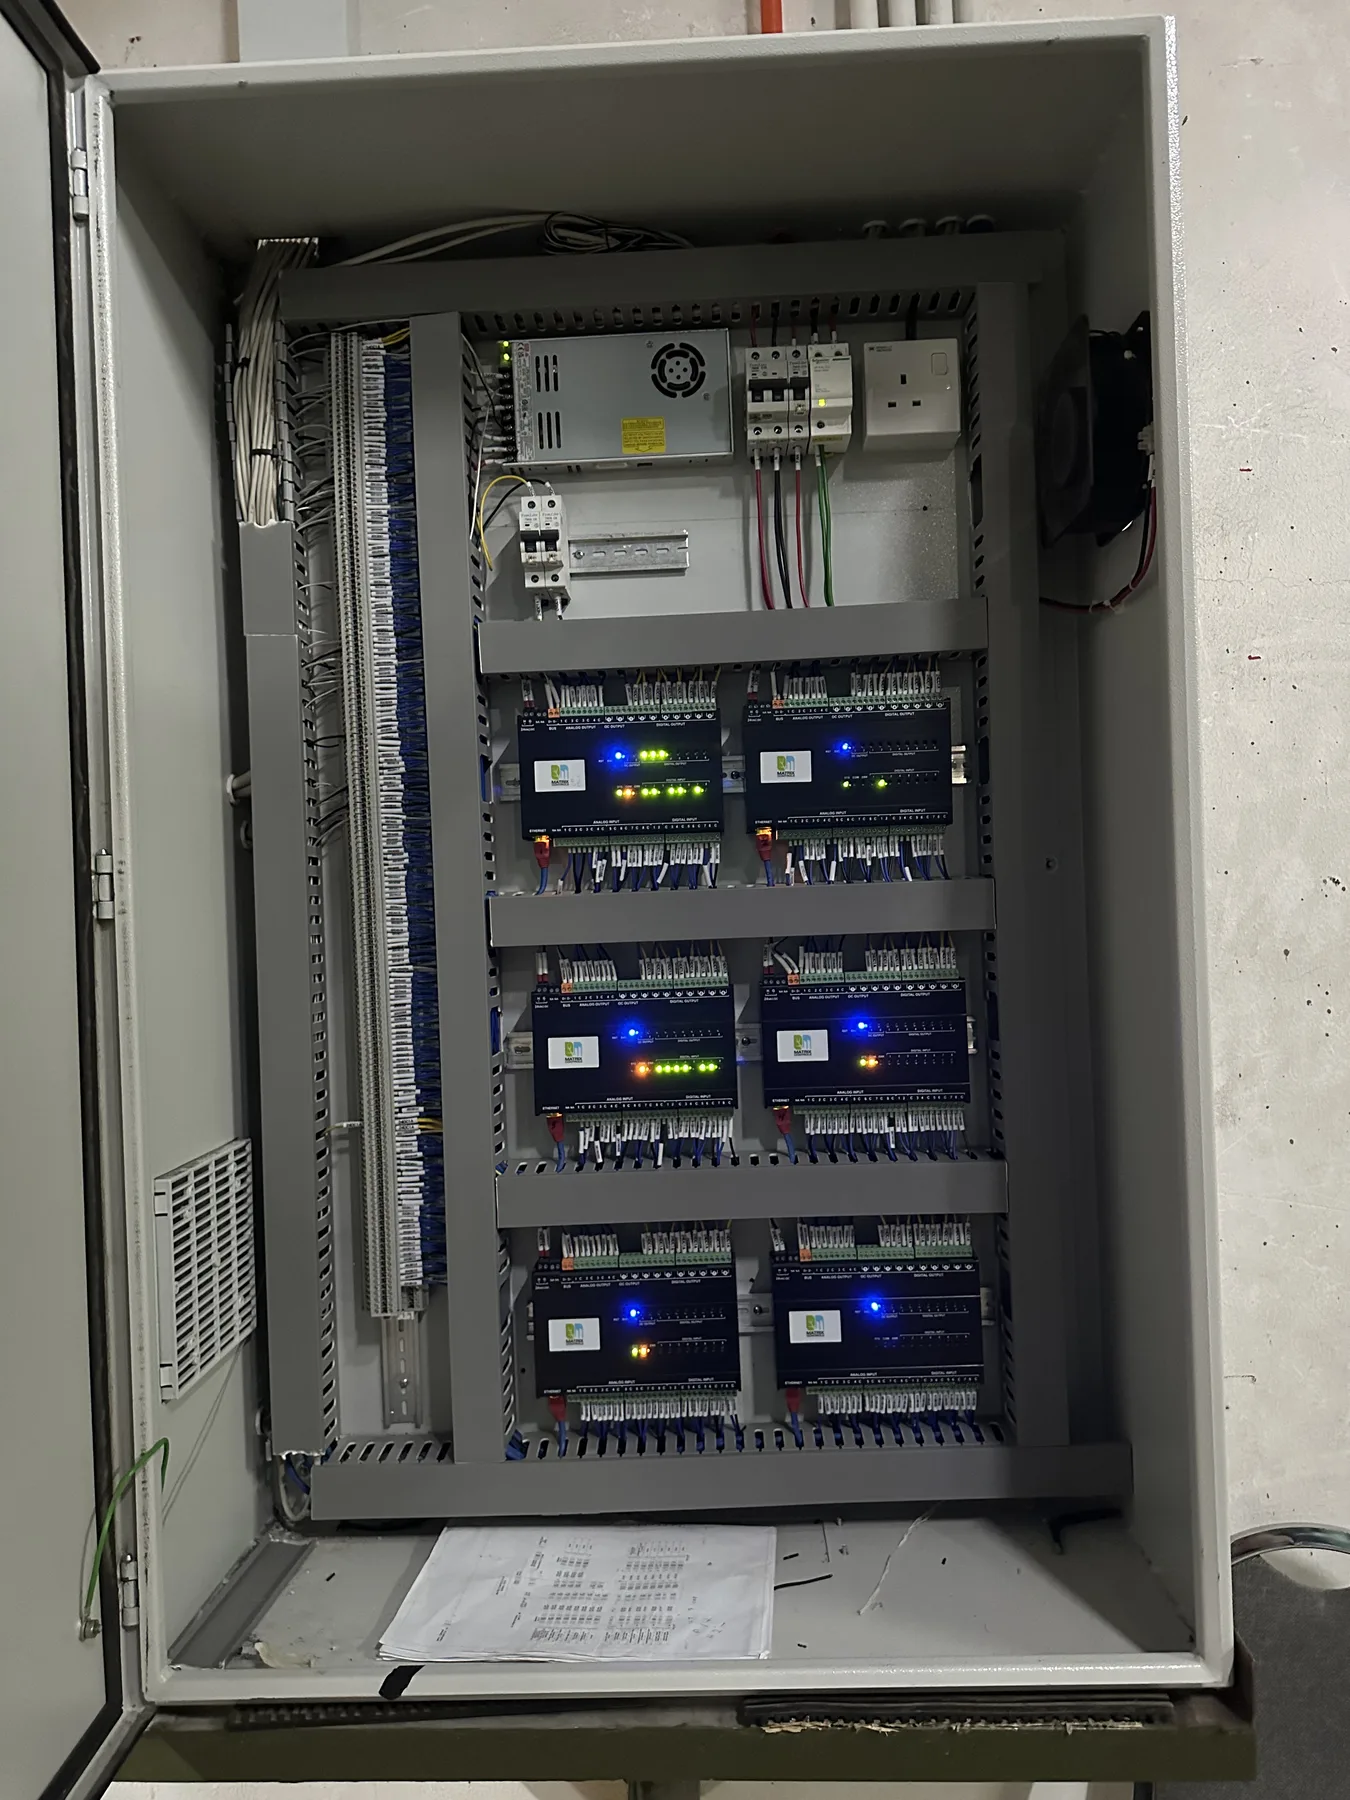
Step 3: Hardware Installation and Control Panel Preparation
With the point list, gateway plan, and drawings approved, controllers, sensors, meters, gateway panels, communication cables, and network equipment are deployed against the reviewed design.
Discipline matters. Site work follows the drawing, not guesswork. Cable tagging, panel labeling, terminal arrangement, gateway placement, power supply, and protection must be clean — the team maintaining this in five years is rarely the team that built it.
For HVAC and plant rooms, installation timing must respect operations. Chiller, pump, AHU, FCU, cooling tower, and meter work often needs coordination with the building team — some activities run live, others require shutdown windows or staged testing.
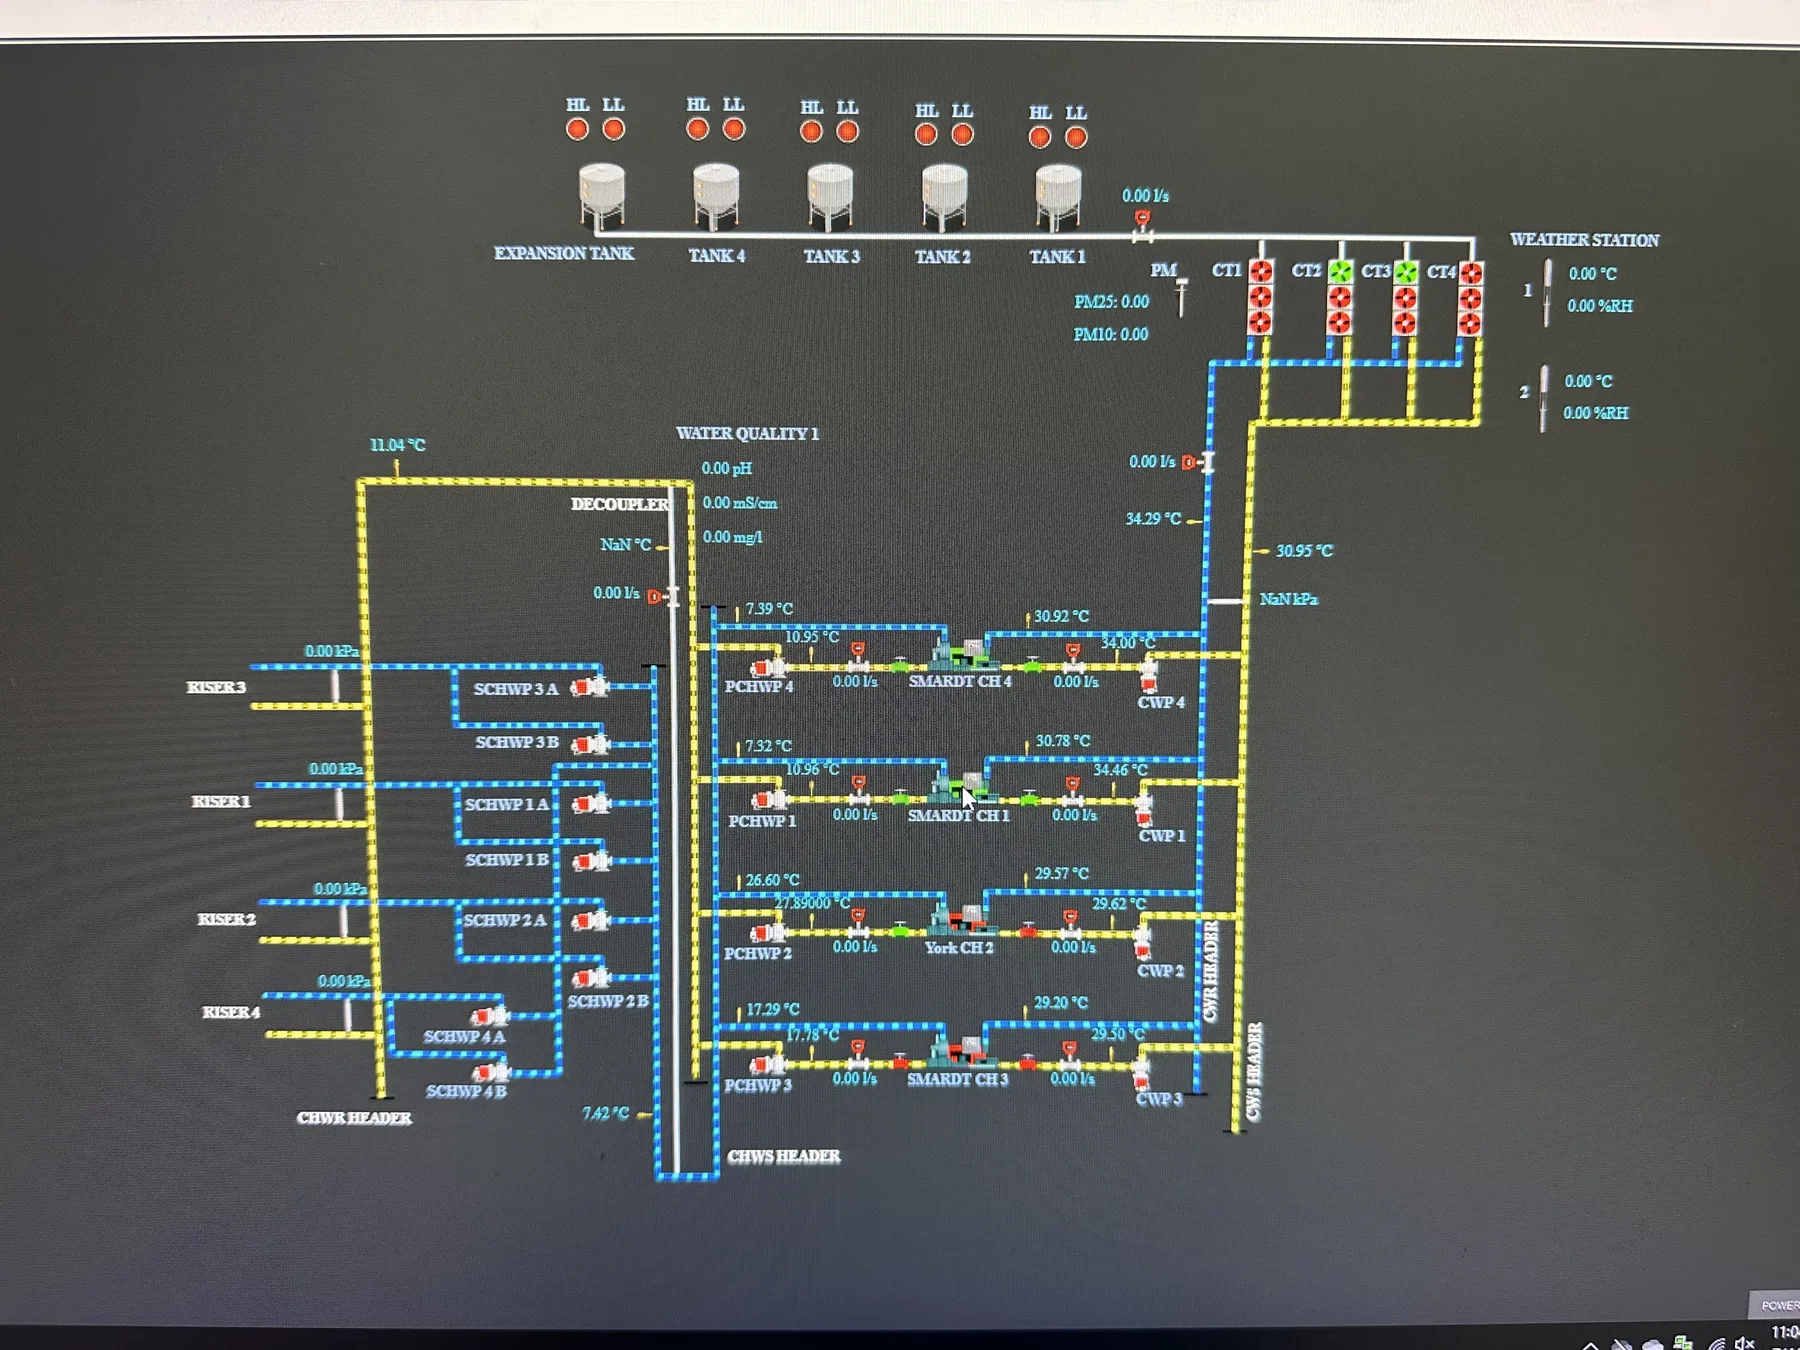
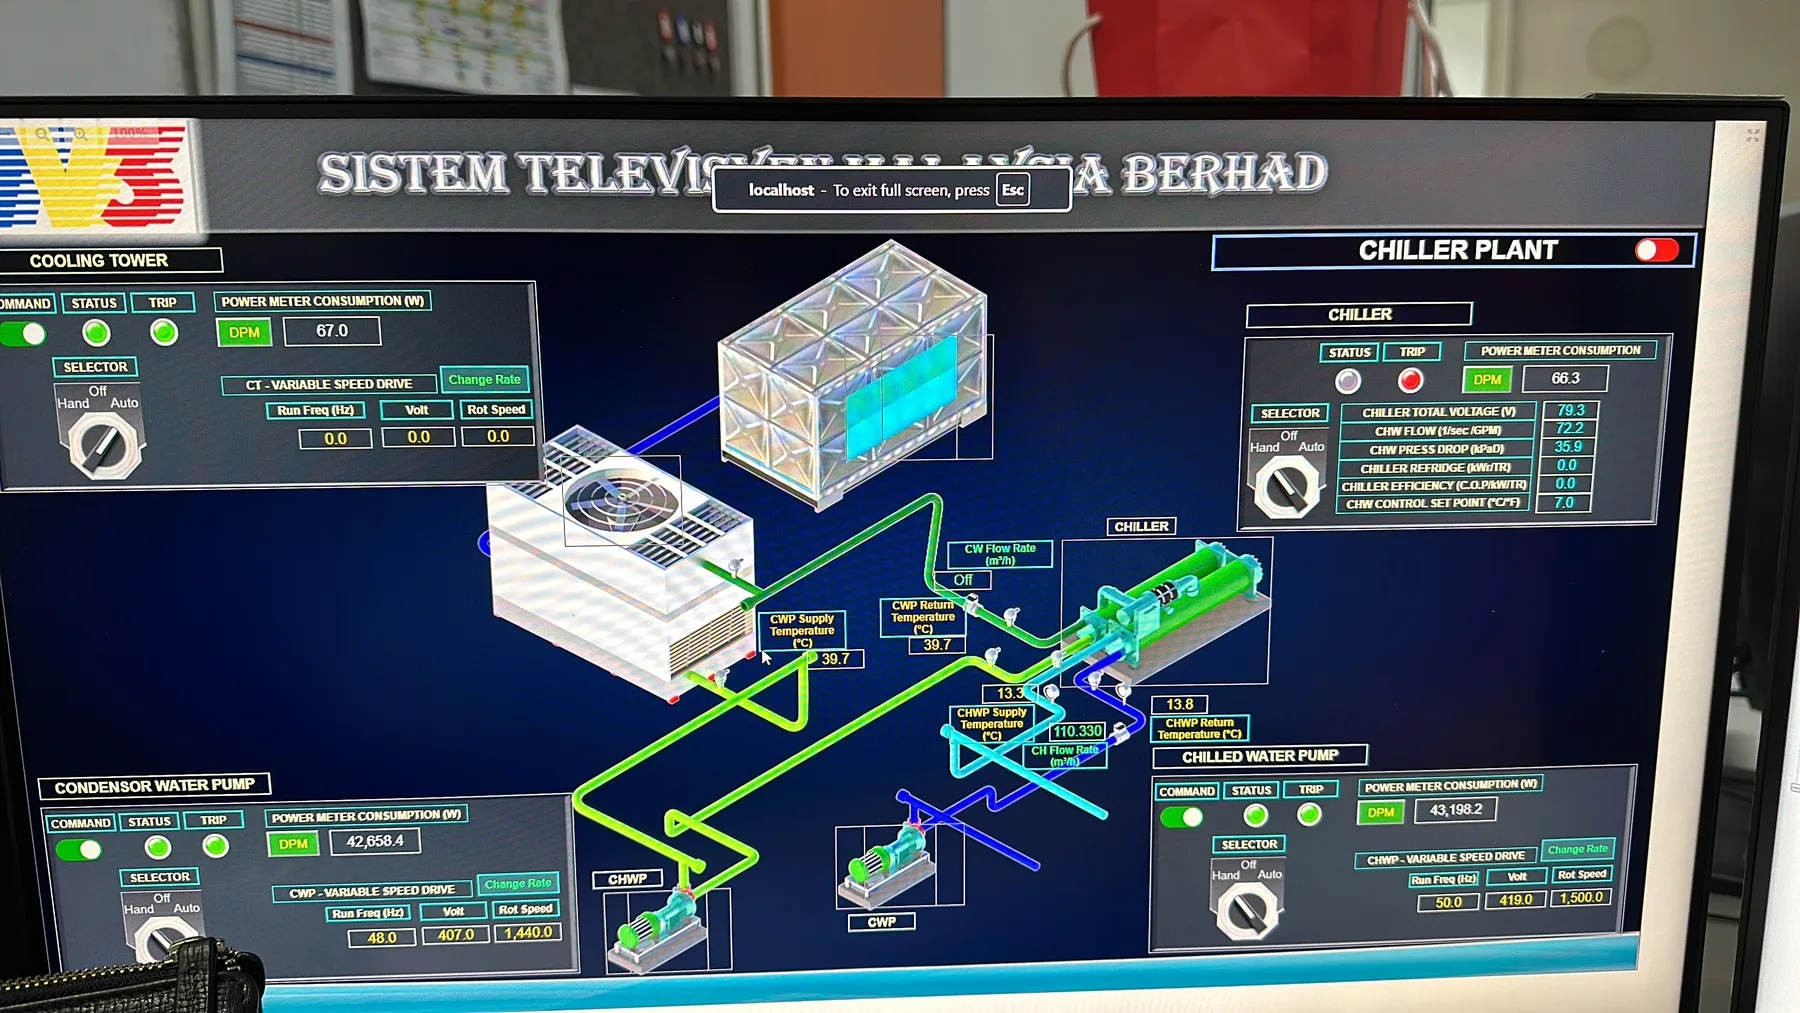
Step 4: BMS, SCADA, and Platform Integration
Once the field layer is ready, the platform connects equipment data into the BMS, SCADA, or energy dashboard: point mapping, tag naming, alarm limits, equipment graphics, trend charts, and live-value confirmation from the field.
Integration is more than live numbers
Every value must mean something to the operator. A temperature point should identify the right zone or AHU. A meter must map to the correct DB or load. A pump alarm must name the pump, the fault, and the expected response.
Control points need stricter governance
Monitoring integrates fast. Control points do not. They affect comfort, energy, equipment protection, and operations. The automation layer must never override engineering safety or create a state the facility team cannot recover from.
Step 5: Testing, Commissioning, and Client Handover
Testing traces every agreed point back to the field — live status, value correctness, alarm behaviour, gateway stability, and operator-readable graphics.
Commissioning is not complete without user confirmation. The facility team should sign off on screen layout, alarm wording, trend needs, report format, and operating workflow. If they cannot use the system during a real incident, the system is not finished.
Handover documentation
- As-built drawings and final point list.
- Gateway details, panel references, and network map.
- Login and access credentials, operating notes, and support escalation path.
Step 6: Monitoring, Optimization, and Continuous Improvement
After handover, the real value begins. The system surfaces energy consumption, HVAC runtime, alarm frequency, abnormal temperatures, chiller plant performance, and meter trends. The first weeks of kWh trending often expose patterns no one could see before.
Optimization stays practical: tighten alarm thresholds, regroup dashboards, refine AHU schedules and occupancy schedules, compare load profiles, review delta-T on the chiller plant, and add new points where they earn their keep. The goal is sharper visibility and faster response — not a more complicated system.
How Our System Supports the Workflow
Once the engineering scope is clear, the platform layer reinforces it with structured data, dashboards, alerts, and reporting tied into ERP and CMMS where useful.
Equipment, IO points, meters, alarms, setpoints, and gateway mappings are organised so every signal has a clear source and purpose.
Chiller, AHU, FCU, pump, cooling tower, sensor, and power meter views follow the way the building is actually run.
Alarms, abnormal readings, equipment trips, and comms failures surface before complaints or manual rounds catch them.
Energy trends, runtime, demand, and exception history feed operational review, maintenance planning, and ESG reporting.
The Result: A Building Automation Project That Can Be Maintained
A strong BMS or HVAC automation project is not a screen with live values. It is a controlled workflow — engineering study, review, installation, integration, testing, handover, and optimization. When IO points are counted properly, gateways are sized correctly, drawings are reviewed, and the consultant or IR is aligned, every downstream phase gets cheaper and more predictable.
That is how M&E implementation becomes building automation: not by jumping to software, but by making the engineering process visible enough for the system to support it properly.