
Energy Management System, or EMS, used to mean a single PC in the M&E office that showed last month’s electricity bill in a bar chart. That definition is gone. For the buildings, factories, malls, hospitals, campuses, and industrial parks our team works with today, EMS is the digital platform that connects field devices to real-time analysis, drives alerting, generates reports, and feeds carbon and cost data into ERP, BMS, and BI tools. It is no longer a dashboard. It is operating infrastructure.
Once a system is doing that much work for that many sites, the old "one server in the basement" deployment stops working. New meters, new sites, new tenants, new reporting requirements arrive faster than a monolithic application can be re-engineered to handle them. Our consultants now design every EMS engagement on the same backbone: a microservices-based cloud architecture, hosted inside a VPC, with the platform separated into layers that can scale, fail, and be replaced independently. The goal is not technical elegance. The goal is an EMS that can start at one building and grow to a hundred without a forklift upgrade.
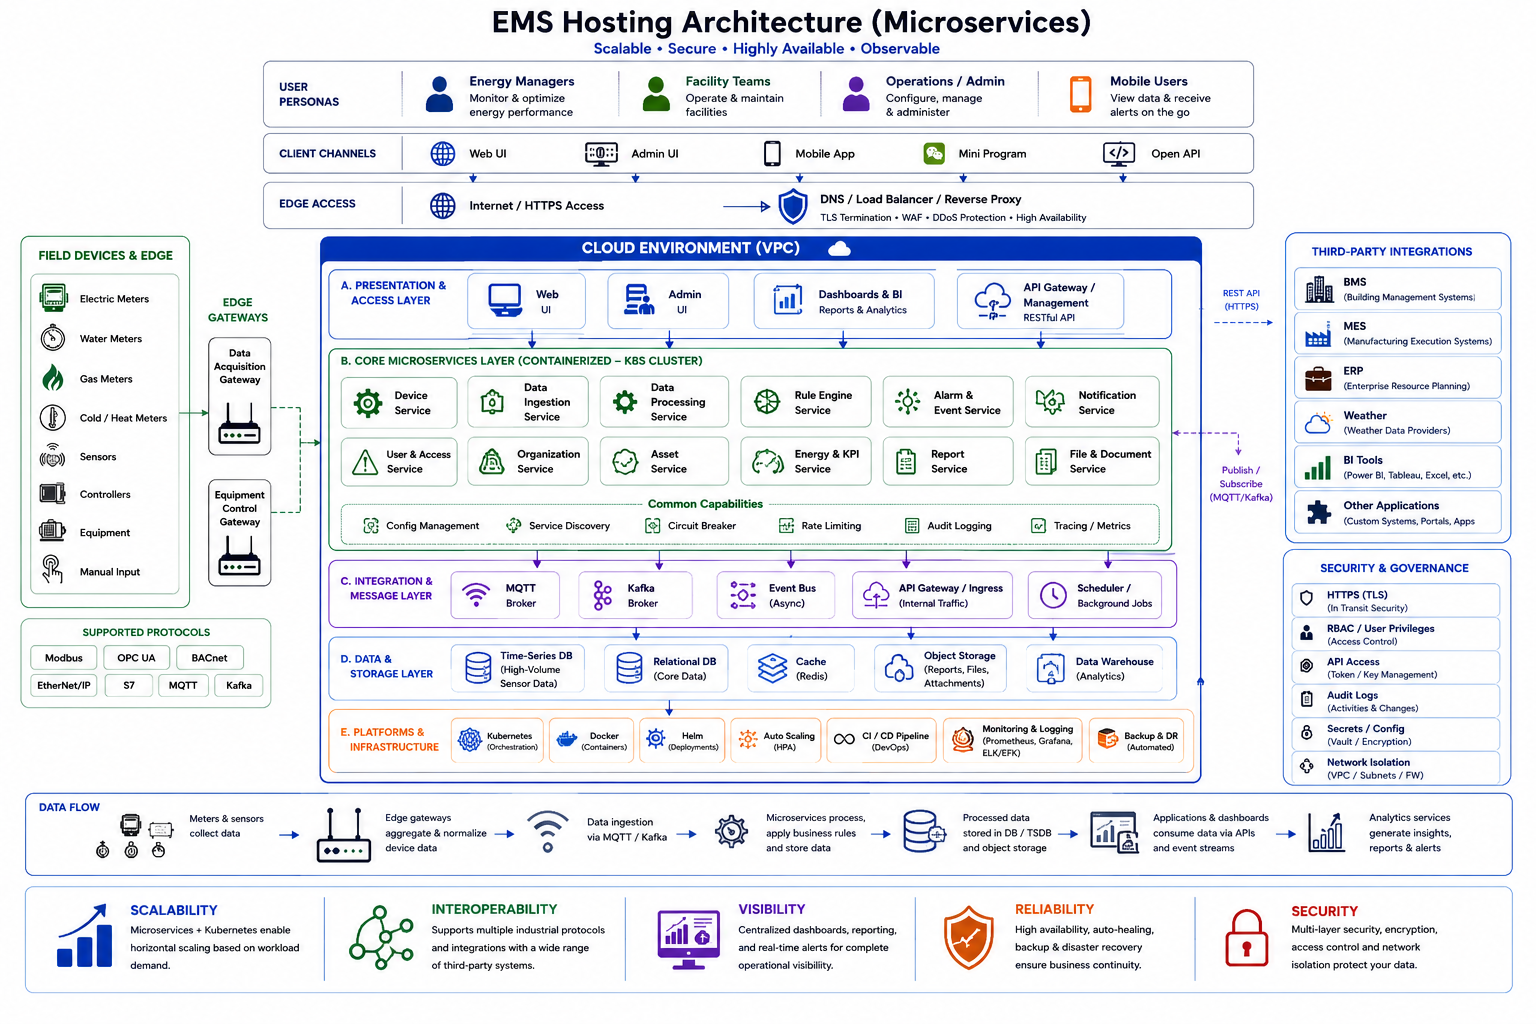
- A modern EMS connects field devices, processes real-time data, runs analytics and alerts, and integrates with BMS, ERP, and carbon reporting — it is no longer a single dashboard.
- Our team designs EMS as a layered microservices platform inside a VPC, so the system can scale by site, by meter volume, or by report load — without rebuilding everything.
- Real-time data is decoupled with MQTT and Kafka, and stored in a time-series database separate from the business database, so the platform stays fast as data volume grows.
- Security is engineered into the architecture — TLS, RBAC, audit logs, secrets management, and network isolation — not bolted on after go-live.
Why EMS Outgrew the Single-Server Dashboard
The clients walking into our team’s discovery calls this year do not want a monitoring dashboard. They want a platform that can do six things at once. Aggregate electricity, water, gas, and chilled-water meters across multiple sites. Generate weekly utility reports and monthly carbon reports without anyone exporting CSVs. Trigger alerts when a chiller draws abnormal load. Push energy intensity numbers into ERP for cost allocation. Compare current consumption against historical baselines and weather conditions. And expose APIs for the building management system, the procurement team, and the sustainability consultant. None of that fits inside one virtual machine.
The constraints come from the data itself. A single site with a few hundred meters reading at 1-minute or 15-minute intervals produces millions of records per year. A portfolio of ten sites multiplies that. If every reading is written into the same database table that also stores user accounts and asset metadata, the database becomes the bottleneck within months. If every gateway pushes data directly to backend services, peak traffic during weekday business hours overwhelms the application and causes dashboards to time out. If every analytics calculation runs in the same process as the user-facing API, a heavy report blocks live screens. Our consultants have inherited enough of these systems to know the failure pattern by heart, and to design around it from day one.
What "scalable" actually means in EMS
When our team writes "scalable" into an EMS proposal, it means something specific: the platform can grow along three independent axes without re-architecting. More sites and more meters should add ingestion capacity, not break the database. More users and richer dashboards should add presentation capacity, not slow down data collection. More reports and analytics jobs should add background processing, not stall the live screens. A microservices architecture makes those three axes truly independent. A monolith couples them, which is why monolithic EMS deployments hit a wall the moment they succeed.
How Our Team Frames the EMS Platform
Every EMS our consultants design follows the same layered model, because the layers map cleanly onto how the system is operated, scaled, and secured. The main platform lives inside a Virtual Private Cloud — a logically isolated network that holds the application, microservices, databases, and message brokers behind controlled entry points. Inside that VPC, the architecture is divided into a presentation and access layer, a core microservices layer, a messaging and integration layer, a data layer, and a platform infrastructure layer. Outside the VPC sit the field devices, the user devices, and the third-party systems that integrate with EMS.
The separation matters for one practical reason: it lets our team change one layer without disturbing the others. When dashboard usage grows, we scale the web application and API gateway. When meter data volume grows, we scale the metering service, message broker, and time-series database. When reporting becomes heavier — month-end, quarterly carbon close, regulator submission — we scale the reporting service alone, on its own schedule. A monolithic deployment cannot do any of that. Every scale-up upgrades the whole system, every patch carries the whole system’s risk, and every failure takes the whole system down.
Presentation and Access: users, internet, DNS, load balancer, WAF — nothing reaches the backend directly. Core Microservices: the business logic, broken into single-purpose services. Messaging and Integration: MQTT, Kafka, event bus — the asynchronous spine. Data: business database, time-series database, object storage, cache — right tool per data shape. Platform Infrastructure: Kubernetes, monitoring, backup, CI/CD, secrets — the foundation that keeps everything else alive.
From Field Meter to the Cloud: The Edge Layer
The story of an EMS data point starts in the plant room, the substation, the utility room, the equipment panel. Electric meters, water meters, gas meters, chilled and hot water meters, sensors, controllers, and machines all generate readings in their own dialects. Our consultants routinely encounter Modbus on older meters, BACnet on building HVAC controllers, OPC UA on industrial equipment, Ethernet/IP and Siemens S7 on factory PLCs, and MQTT on newer IoT devices. None of these protocols speak the same language. None of them are designed to talk to a public cloud across an unreliable wide-area network.
That is why our team treats the gateway tier as a non-negotiable part of the architecture, not an afterthought. A data acquisition gateway sits at the site, polls the field devices in their native protocols, normalises the readings into a consistent payload, buffers data when the network drops, and securely forwards the stream to the cloud. An equipment control gateway adds the reverse path: cloud-side commands can be relayed back to controllers for setpoint changes, scheduled operations, or automation rules. The gateway converts a fragile site-to-cloud link into a resilient one, and converts a polyglot device fleet into a single uniform feed for the platform to consume.
Why the gateway changes what EMS can do
With a proper gateway tier, the EMS is no longer constrained to "whatever happens to be reachable from the cloud right now". It becomes a complete history of what the site did, even when the link to the cloud was down. It becomes a foundation for two-way control, which is what turns an EMS from a reporting tool into a smart facility platform. And it becomes the trust boundary between the operational technology network and the IT network — which, for any client our consultants advise in healthcare, manufacturing, or regulated property, is a security requirement, not a preference.
The Microservices That Make EMS Work
Inside the VPC, our team breaks the EMS application into single-responsibility services. Each one owns a clearly bounded part of the business and can be developed, deployed, and scaled by itself. A typical deployment includes a user service for accounts, roles, RBAC, and access control. An asset service for sites, buildings, floors, zones, equipment, meters, sensors, and their relationships. A metering service for ingestion, data collection, raw reading processing, and device data handling. An analytics service for trends, comparisons, performance indicators, and energy insights. An alarm service for threshold violations, abnormal readings, missing data, and equipment alerts. A reporting service for daily, weekly, monthly, and custom report generation. A schedule service for recurring jobs and automated report runs. A workflow service for approval flows, work order routing, and operational procedures. A notification service for email, SMS, WhatsApp, WeChat, and in-app notifications. And a file service for attachments, exported reports, and document storage.
Two things happen the moment the application is split this way. First, each service can be scaled to fit its actual workload. When month-end reporting peaks, the reporting service spins up additional instances without touching the metering pipeline. When meter ingestion spikes during a new site rollout, the metering service and message broker scale independently of the user-facing dashboards. Second, the failure domains shrink dramatically. If the analytics service crashes during a heavy query, the alarm service keeps running, the dashboards stay live, and meter data keeps being collected. A monolith would have taken the whole platform down.
Messaging That Keeps Real-Time Data Honest
If every gateway and every microservice talked directly to the database, the system would collapse the first time a site rolled out a hundred new sensors. Our team always inserts a messaging and integration layer between data producers and data consumers, because asynchronous communication is the only way to make real-time data scale predictably. The two workhorses are an MQTT broker for lightweight, IoT-style device traffic, and a Kafka broker or event bus for high-volume streaming and event-driven workflows.
The MQTT broker fits the edge use case: gateways publish meter readings and sensor events to topics, and backend services subscribe to the topics they care about. The publisher and subscriber never have to know about each other directly, and a new analytics service can be plugged in next month without modifying the gateway code. Kafka or an event bus handles the heavier patterns — cleaning, validation, storage, alarm checking, analytics, and reporting can all be triggered as parallel downstream consumers of a single inbound event. When something fails, the message stays in the queue until the service recovers; nothing is silently lost. When traffic spikes, the broker absorbs the burst so the downstream services do not have to.
Why this matters to the operator, not just the architect
The operational benefit our team explains to every client’s management team is simple: the messaging layer is what makes the dashboard’s real-time numbers actually correspond to reality, even when the world misbehaves. If a backend service is being upgraded, meter readings still arrive and are processed when the service comes back. If a single site’s gateway floods the system after a network outage, the broker rate-limits the impact instead of crashing the platform. Reliability is not a property of any one service; it is a property of the messaging layer that connects them.
Storing Energy Data Without Drowning In It
The data layer is where most EMS architectures go wrong, and where our consultants put a disproportionate amount of design effort. The rule is that not all data belongs in the same database. The platform our team builds always separates four data shapes into four storage components. A relational database cluster holds user accounts, configuration, metadata, asset records, alarm rules, permissions, and system settings — the structured, lower-volume "business" data. A purpose-built time-series database holds meter readings, sensor readings, equipment telemetry, and historical trend data — the high-volume measurement data. File or object storage holds reports, attachments, exported files, and backups — the unstructured assets. A cache layer holds frequently accessed dashboard data, sessions, and repeated query results — the hot read path.
The reason for the split becomes obvious the first time a client’s site grows past a few hundred meters. At 15-minute intervals, a few hundred meters generate tens of millions of records per year. Tens of sites, multiple tens of millions. A normal relational database struggles to query that volume for a typical "show me last month’s 15-minute load profile" request. A time-series database does it routinely, because it is designed for exactly that shape of data. Our team separates the two so the business database stays small, fast, and easy to back up, while the time-series database carries the measurement volume on infrastructure optimised for it.
Hosting, Deployment, and How the Platform Stays Up
The platform infrastructure layer is the layer that determines whether the EMS our team builds in week one is still operable in year five. For smaller single-site deployments, our consultants often start with virtual machines and Docker containers because the operational overhead is lower and the team can be onboarded quickly. For larger enterprise and multi-site deployments, Kubernetes becomes the right choice because it gives our team container orchestration, auto-scaling, service discovery, rolling updates, and the workload management capabilities that a manually managed VM fleet cannot match. A service mesh is layered on when traffic patterns between services need fine-grained control, observability, or mutual TLS.
Around the orchestration, our team designs in the operational essentials from day one. Monitoring and logging cover system metrics, service health, error tracking, and performance visibility — the platform team should know about a problem before the client’s facility manager does. Automated backup and restore protect against data loss and support disaster recovery exercises that actually get run. CI/CD pipelines automate deployment, rollback, patching, and version control so that updates do not depend on a single person remembering the steps. Secrets management stores API keys, certificates, database passwords, and sensitive configuration in a vault rather than a config file. None of these are optional. They are what separates an EMS that survives staff turnover from one that becomes unmaintainable two years in.
Every layer of the platform must answer four questions before go-live: how do we know it is healthy, how do we scale it, how do we roll back a bad change, and how do we recover it after a failure. If any of those answers is "the original engineer knows", the design is not done. The infrastructure layer is where those four answers get baked in, before the first dashboard goes live, so that the EMS can be operated by a normal facility team without a vendor on standby.
Integrating EMS With BMS, ERP, and Carbon Reporting
An EMS that lives in isolation is worth a fraction of an EMS that is integrated. The clients our team works with want energy data flowing into their financial close, their carbon disclosure, their facility operations, and their executive BI reporting — not sitting in a separate portal that someone has to remember to log into. The architecture supports that through a well-defined third-party integration layer.
Building Management Systems integrate at the equipment monitoring and control level, so chiller, AHU, and lighting performance can be correlated with measured energy use. Manufacturing Execution Systems integrate at the production level, so kWh per unit produced becomes a real KPI instead of a periodic spreadsheet calculation. ERP integrates at the finance and procurement level, so utility cost is allocated correctly to cost centres, departments, or tenants without manual reconciliation. Weather data providers integrate at the analysis level, so consumption is benchmarked against degree days, ambient temperature, and humidity. BI tools — Power BI, Tableau, others — integrate at the executive reporting level, so management sees energy alongside revenue, headcount, and production. Other applications — custom portals, carbon platforms, ESG systems — integrate as the client’s ecosystem evolves.
The technical patterns are deliberately small. Most integrations are REST APIs over HTTPS. Some, especially for streaming or event-driven scenarios, use MQTT or Kafka topics that downstream systems subscribe to. Our team avoids point-to-point custom integrations wherever possible — every integration goes through a documented API or event contract, so the client’s next system in the queue can be plugged in without re-engineering the EMS.
Security and Governance: Why the EMS Owner Sleeps at Night
EMS platforms hold building operation data, energy consumption data, user information, business reports, and integration credentials. For some clients our consultants advise, they also hold operational technology control paths that, if compromised, could affect physical equipment. Security is not a feature; it is a property of the entire design. Our team builds in a multi-layered control set from the start.
HTTPS and TLS protect data in transit between users, APIs, gateways, and backend services. RBAC ensures users can only access the modules, sites, and data they are authorised to view — an energy manager for one tenant cannot see another tenant’s meters. API access control governs tokens, keys, rate limits, and external integration permissions, so a partner’s credentials can be revoked without affecting anyone else. Audit logs record user actions, configuration changes, login activity, and system operations, which is what makes compliance reviews and incident investigations possible. Secrets and configuration management protects passwords, certificates, API keys, and encryption keys in a vault rather than in code or config files. Network isolation separates public access, private services, databases, and internal systems through VPC subnets, firewall rules, and security policies.
The End-to-End Data Flow, In Plain Terms
The full path a single reading takes through the platform is the clearest way to see why the architecture our team designs holds together. A meter takes a reading. The site gateway polls it in its native protocol, normalises the payload, and forwards it to the cloud over a secure channel. The message lands on the MQTT broker. The metering service consumes it, validates it, and writes the cleaned reading into the time-series database. The same event fans out to the analytics service, which updates aggregates and intensity calculations, and to the alarm service, which checks the reading against configured rules. If a threshold is crossed, the notification service dispatches the alert through email, SMS, or in-app channels. The reading is now visible on the dashboard, available through the API, included in next month’s report, and ready to be pushed to ERP for cost allocation or to a BI tool for executive reporting. Every step is independently scalable, independently observable, and independently recoverable.
Why This Architecture Is the Foundation for the Next Five Years
The clients our team is signing this year are not just buying an EMS. They are buying the foundation for energy intensity reduction targets, carbon disclosure requirements, multi-site operational efficiency programmes, and sustainability strategies that their boards have already committed to in public. The architecture has to last. Microservices and container orchestration let the platform scale horizontally as sites, meters, and users grow. Load balancing, clustered services, message brokers, backups, and active monitoring make the platform highly available, so reporting and alerting keep working even when individual components fail. Multiple industrial protocols and a clean integration layer make the platform interoperable across industries and facility types. Centralised dashboards, reports, alarms, analytics, and logs make the platform visible — management sees energy performance in real time and historically. Layered security, encryption, access control, audit logs, and network isolation make the platform safe to host the data the client cares about.
An EMS designed this way is more than a dashboard. It is a digital infrastructure that connects the physical site to the rest of the business and to the regulatory environment around it. It is the system our team builds because it is the system our clients need to run a building, a portfolio, or a manufacturing operation responsibly for the next decade — not the next quarter.